Kai Riemer, Ethan M. Rowland, Chee Hau Leow, Peter D Weinberg, Meng-Xing Tang “Determining Haemodynamic Wall Shear Stress in the Rabbit Aorta In Vivo Using Contrast-Enhanced Ultrasound Image Velocimetry“
Annals of Biomedical Engineering (2020)
DOI: https://doi.org/10.1007/s10439-020-02484-2
Affiliation:
Kai Riemer, Ethan M. Rowland, Chee Hau Leow, Peter D Weinberg and Meng-Xing Tang with the Department of Bioengineering, Imperial College London, United Kingdom.

Abstract:
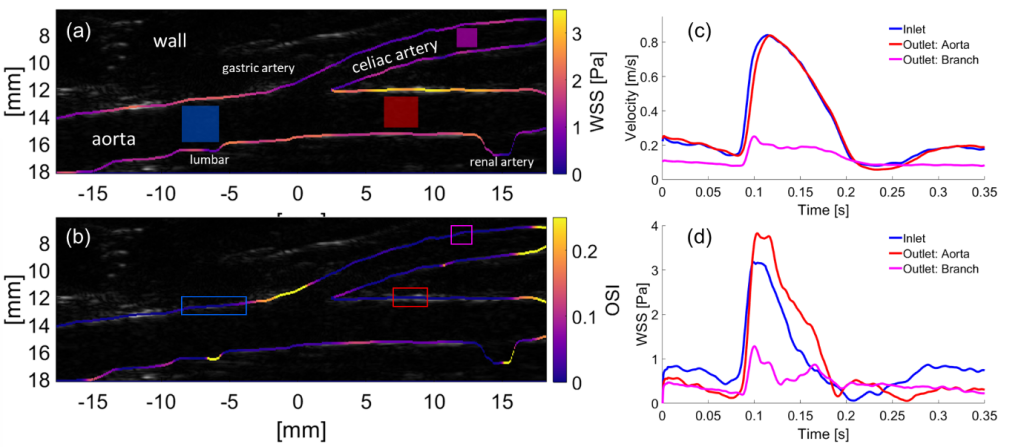
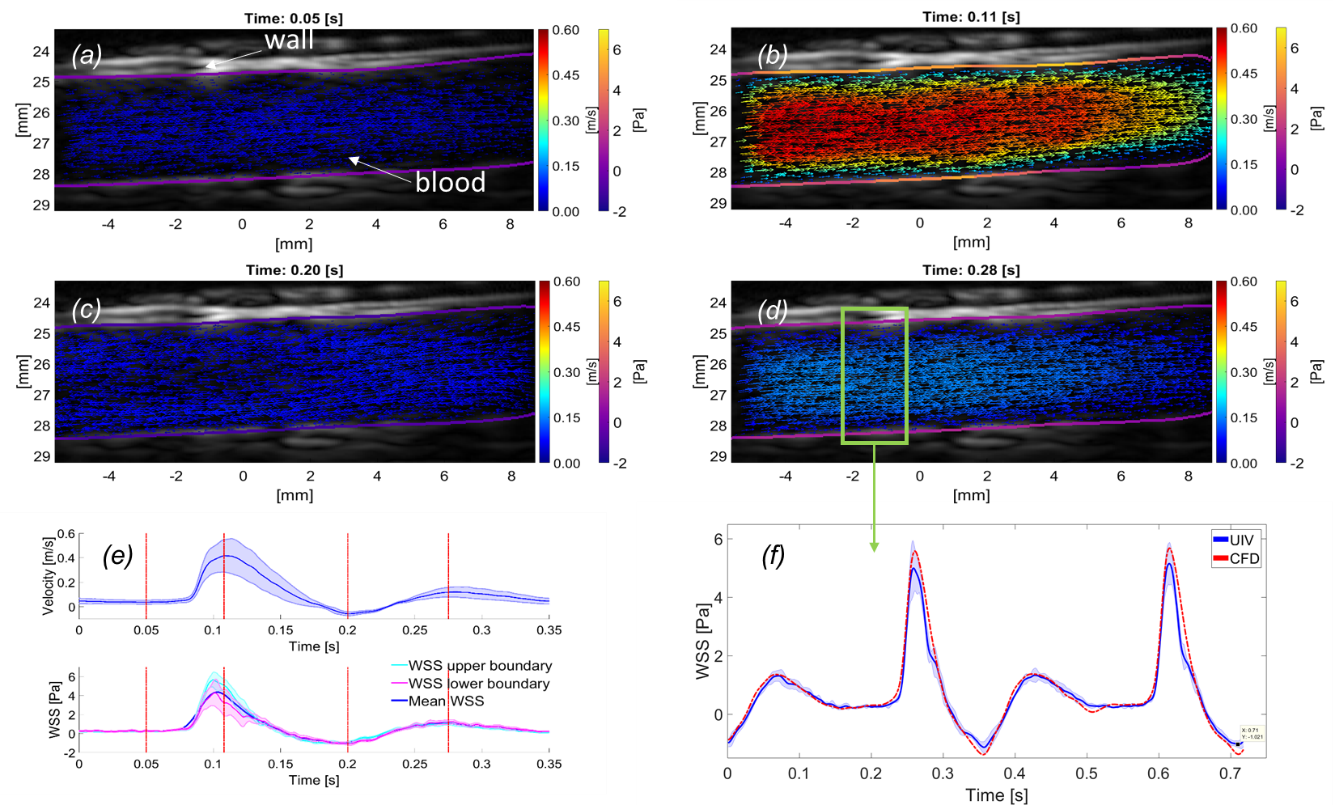
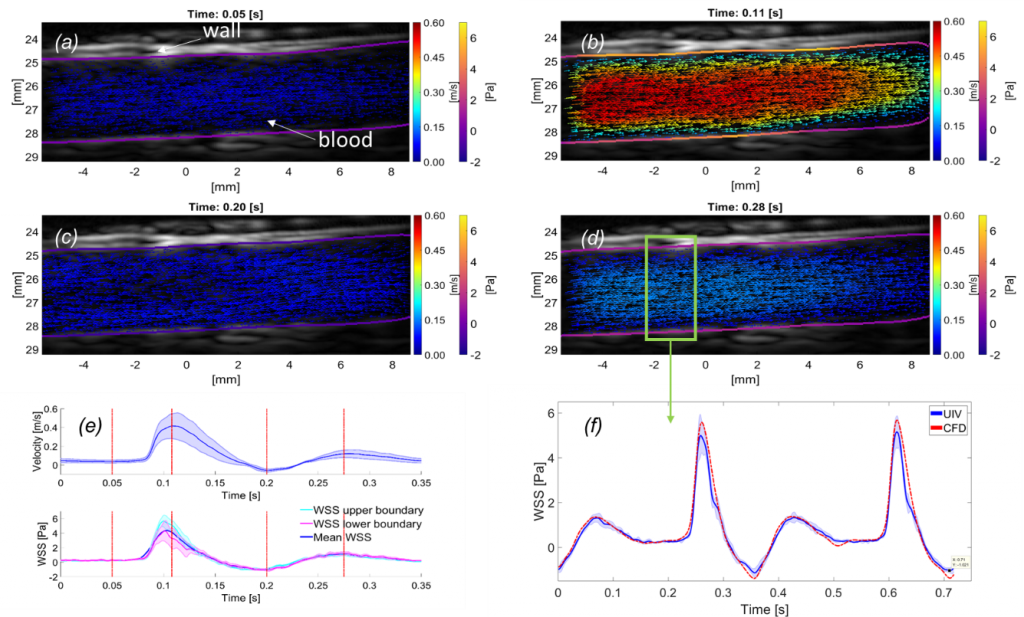
Abnormal blood flow and wall shear stress (WSS) can cause and be caused by cardiovascular disease. To date, however, no standard method has been established for mapping WSS in vivo. Here we demonstrate wide-field assessment of WSS in the rabbit abdominal aorta using contrast-enhanced ultrasound image velocimetry (UIV). Flow and WSS measurements were made independent of beam angle, curvature or branching. Measurements were validated in an in silico model of the rabbit thoracic aorta with moving walls and pulsatile flow. Mean errors over a cardiac cycle for velocity and WSS were 0.34 and 1.69%, respectively. In vivo time average WSS in a straight segment of the suprarenal aorta correlated highly with simulations (PC = 0.99) with a mean deviation of 0.29 Pa or 5.16%. To assess fundamental plausibility of the measurement, UIV WSS was compared to an analytic approximation derived from the Poiseuille equation; the discrepancy was 17%. Mapping of WSS was also demonstrated in regions of arterial branching. High time average WSS (TAWSSxz = 3.4 Pa) and oscillatory flow (OSIxz = 0.3) were observed near the origin of conduit arteries. In conclusion, we have demonstrated that contrast-enhanced UIV is capable of measuring spatiotemporal variation in flow velocity, arterial wall location and hence WSS in vivo with high accuracy over a large field of view.
Supporting Bodies:
This work was funded by the British Heart Foundation Centre for Research Excellence, the British Heart Foundation under Grant PG/16/95/32350 and the Engineering and Physical Sciences Research Council under Grant EP/M011933/1.